×
The control you want, the sales data you need.
Visualize and track your sales KPIs with just a few clicks.
Request Demo
Sales insights enhance decision making.
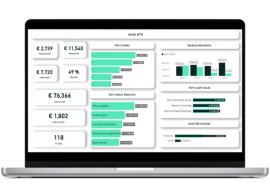
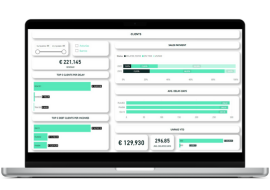
Sales department in general and sales leadership in particular are always under pressure to overachieve goals and generate more leads to convert in new customers. That is why there is no time for data analyzing and shaping them into visuals.We know how important it is to have control of your data, which is why we builed this modern sales business intelligence reports, centralizing all your metrics in one central BI tool.
Using business intelligence to visualize and track sales data empowers businesses to make data-driven decisions, optimize sales strategies, improve forecasting, and gain a competitive advantage in the market.
It enhances collaboration, facilitates real-time monitoring, and provides a comprehensive view of sales performance, ultimately leading to increased revenue and operational efficiency.
Sales dashboard examples
Check out our sales analytics examples
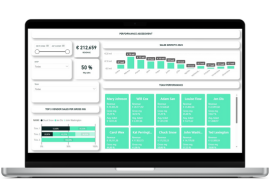
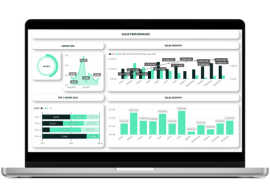
Sales team performance
Track performance and motivate your team to reach sales targets.
VIEW LIVE DASHBOARD
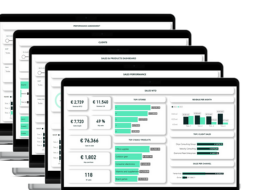
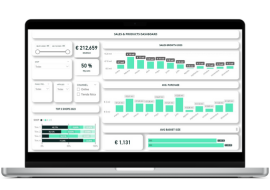
Sales full
Sales x5! Get a complete overview of the main sales department kpis.
VIEW LIVE DASHBOARD
Metrics and kpi examples
Learn about and use our pre-built metrics to monitor your business data.
Sales Target
Measure and compare current sales to a target or past performance.
Sales Opportunities
Organize prospects based on opportunity value and probability.
Conversion Rate
Measure of the effectiveness of your sales team at converting leads into new customers.
Sales-to-Date
Monitor and measure the total value of sales that have occurred over-time.
Sale per Rep
Measure the performance of each of your sales reps or sales teams.
Product Performance
Track and rank your products based on sales revenue performance.
Sales by Region
Zero in on the volume of sales by location.
Average Purchase Value
Measure the average sales value of each transaction.
Customer Acquisition Cost
Measure how much it costs to obtain a new customer.
Customer Lifetime Value (CLV or LTV)
Measure the amount of money a customer brings in over the entire time they do business with a company.
Trial Accounts
Track the number of open trial accounta.
Gross Margin Return on Investment (GMROI)
Measure the total revenue gained after covering the investment of making the sale.
Sales Cycle Duration
Monitor the length of time between the initation of the sales process to the final sale.

